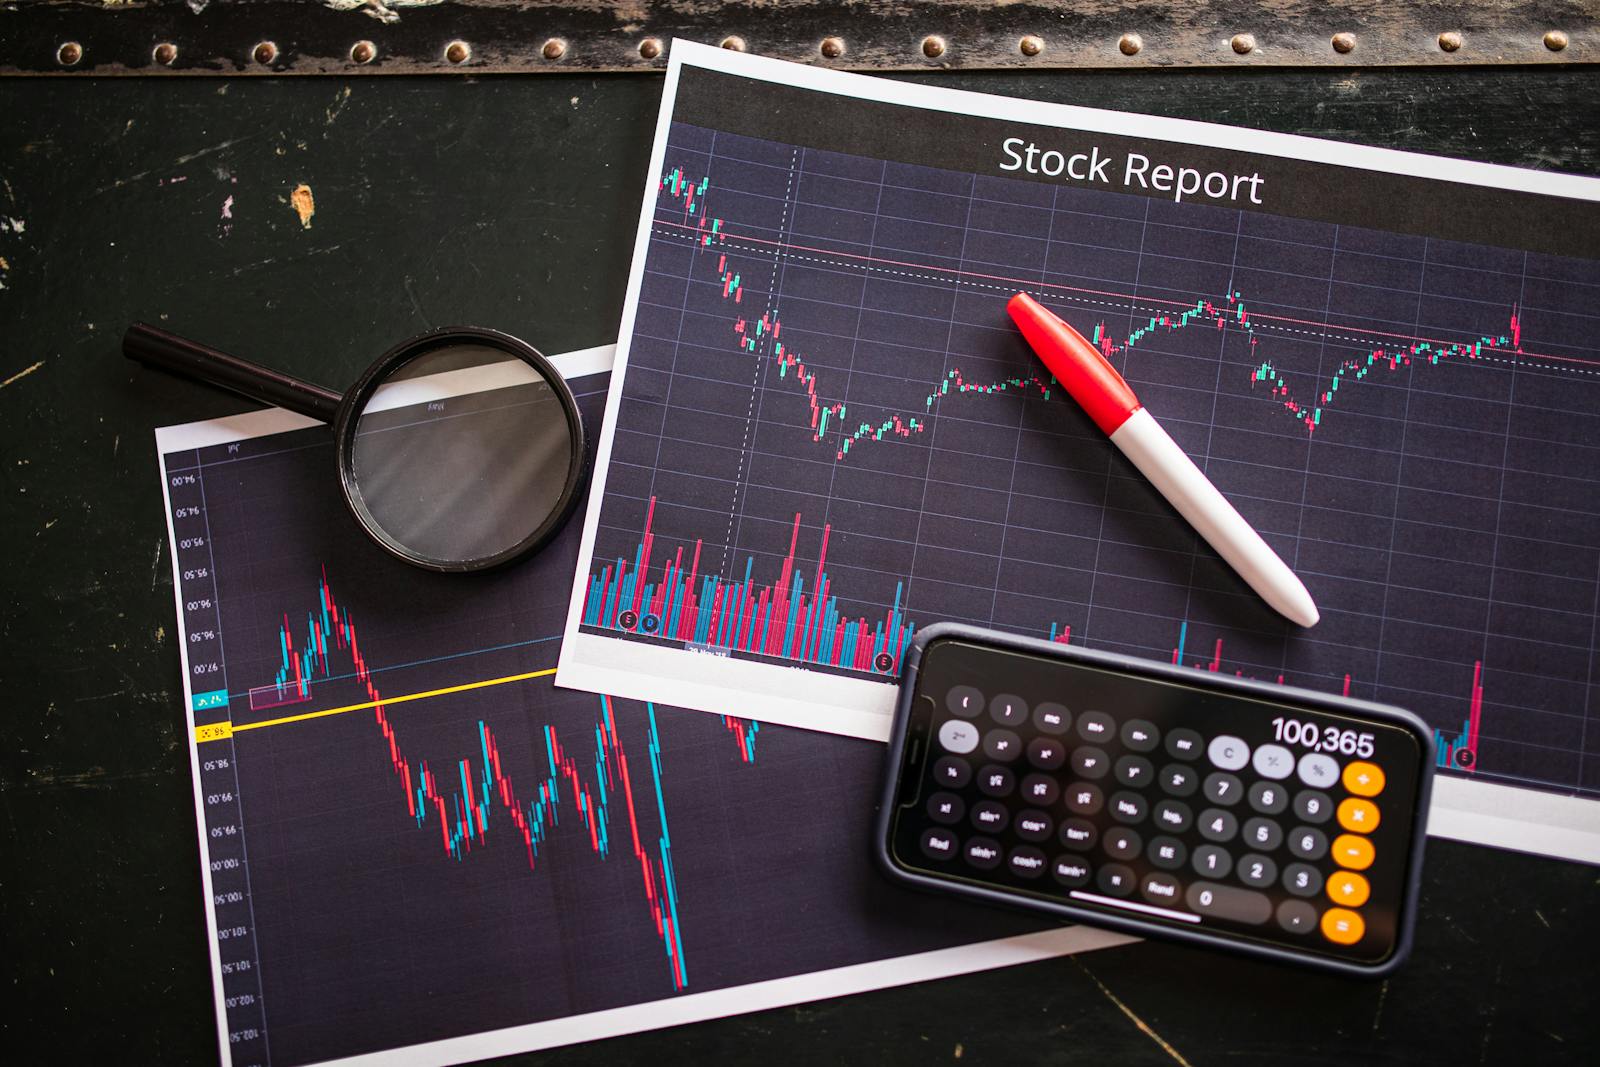
Yahoo Finance has long been a trusted platform for investors, offering a wealth of tools and features for analyzing stocks, tracking market trends, and making data-driven financial decisions. One question often asked by users is, “Can you stack stock charts on Yahoo Finance?” In this guide, we’ll explore whether Yahoo Finance allows you to stack stock charts, the benefits of chart stacking, and alternative tools that make it easier to compare stock data side-by-side.
Understanding Yahoo Finance’s Charting Capabilities
Yahoo Finance offers powerful charting tools that allow users to view historical data, analyze technical indicators, and compare multiple stocks on a single chart. However, Yahoo Finance does not currently support stacking stock charts in the traditional sense (layering multiple stocks with separate price axes on the same chart). Instead, it allows for overlaying different stocks on a single chart, which can be beneficial for comparing performance trends.
Why Stack or Overlay Stock Charts?
Stacking or overlaying stock charts offers investors several advantages:
- Enhanced Comparison: By viewing two or more stocks on the same chart, you can easily compare their performance over a selected time frame.
- Quick Analysis of Sector or Industry Trends: Overlaying stocks from the same sector provides insights into broader industry performance and reveals whether specific stocks are outperforming or underperforming relative to their peers.
- Improved Decision Making: Seeing trends and correlations between multiple stocks helps investors make more informed decisions regarding portfolio diversification.
How to Overlay Stock Charts on Yahoo Finance
While Yahoo Finance doesn’t stack charts in a true layered format, it allows users to overlay multiple stocks. Here’s a step-by-step guide:
- Open Yahoo Finance: Go to Yahoo Finance and enter the ticker symbol for the primary stock you want to analyze.
- Navigate to the Charting Section: Click on the “Chart” tab to open the stock’s interactive chart.
- Add Comparison Stocks:
- On the chart interface, look for the “Compare” button, usually located above the chart.
- Click “Add Symbol” and enter the ticker symbol for the stock(s) you wish to compare. Yahoo Finance will display each stock on the same chart with distinct colors for clarity.
- Adjust Chart Settings: Customize the time frame, chart type (line, candlestick, etc.), and technical indicators as needed.
- Analyze the Overlay: Observe the performance trends, correlation, and deviations between the selected stocks.
Limitations of Yahoo Finance’s Overlay Feature
Although Yahoo Finance’s overlay feature is helpful, it has limitations:
- Lack of Separate Axes: Yahoo Finance displays multiple stocks on a single price axis, which can make it challenging to analyze stocks with vastly different prices.
- Limited Technical Indicators for Comparison Stocks: While primary stocks can include various indicators, the overlayed stocks may not support the same level of detail in technical indicators.
- No Custom Stacking Option: The inability to stack separate price axes on Yahoo Finance limits in-depth comparative analysis.
Alternatives for Stacking Stock Charts
If you need true stacking capabilities, consider the following tools:
- TradingView: TradingView allows users to stack stock charts, providing separate price scales for each stock. It also offers a wide range of technical indicators and advanced charting tools.
- ThinkorSwim (TD Ameritrade): Known for its professional-grade tools, ThinkorSwim supports multiple charts on the same screen, allowing for advanced comparison and analysis.
- StockCharts.com: This platform offers a side-by-side chart view and can display multiple price scales, enabling users to stack charts effectively.
Frequently Asked Questions (FAQs)
Can You Stack Stock Charts on Yahoo Finance?
While Yahoo Finance does not allow true chart stacking, it enables users to overlay multiple stocks on the same chart, which provides some comparison functionality.
Is Stacking Stock Charts Beneficial?
Yes, stacking or overlaying stock charts allows for an in-depth comparative analysis, helping investors assess performance trends, correlations, and deviations among different stocks.
Are There Alternatives to Yahoo Finance for Stacking Stock Charts?
Yes, platforms like TradingView, ThinkorSwim, and StockCharts.com offer more advanced chart-stacking features for users who require separate price axes or additional customization.
Final Thoughts
Yahoo Finance remains a valuable resource for investors due to its user-friendly interface and robust charting capabilities. Although it doesn’t support true chart stacking, the overlay feature enables comparative analysis that can assist in investment decision-making. For those seeking more advanced capabilities, exploring alternatives like TradingView or ThinkorSwim may be beneficial. Whether you’re a beginner or a seasoned investor, making the most of Yahoo Finance’s tools can enhance your stock analysis and keep you informed in a dynamic market.


